Spring, 2019
Click the image to start/stop the video
Burden of Proof: Beginnings of the Crisis
In April 2014, the city of Flint, Michigan changed its water supply from Lake Huron to the Flint River as a temporary change while awaiting future connection to the Karegnondi Water Authority. As a result, untreated water from the river corroded the city’s lead and copper piping, delivering contaminated water to roughly 100,000 residents.
While residents immediately raised concerns over negative changes in the quality of the water, city leaders insisted the metal content was below EPA standards. By January of 2015, citizens of Flint were complaining of health issues related to drinking water, bringing bottles of discolored water to town hall meetings. Though news outlets had begun reporting on the quality of Flint’s water, state and local officials failed to acknowledge an issue.
During this time, abnormal outbreaks of Legionnaires disease in Flint went largely ignored. Current court case facts reveal that the Deputy Director of the Michigan Department of Health and Human Services (MDHHS) could have issued a public health warning in January of 2015 as the concern was actually flagged internally. By late 2015, a group of independent doctors from the Hurley Medical Center had found definitive proof of the presence of unusually high levels of lead in children’s blood samples as a direct result of the quality of the water. However, it wasn’t until January 2016 that government officials formally acknowledged a state of emergency in Flint. Finally, the Environmental Protection Agency (EPA) stepped in to monitor the water quality and the University of Michigan began digitizing maps of Flint’s water pipes.
Surveilling the Crisis from Above
Though the residents of Flint had first-hand knowledge of a problem with their tap water almost immediately after the switch, the timelines for water quality and blood lead-level data collection greatly varies across governing bodies. This variation, and subsequent government response, raises the question: who knew what, when?
Datascaping the Flint Water Crisis aims to address this question, exploring the relationships between data, visibility and authority in crises scenarios. Using four data-sets taken from three different authoritative actors involved in the Flint water crisis, our video explores how and when authoritative bodies seek to “clarify” or make visible a crisis according to their needs.
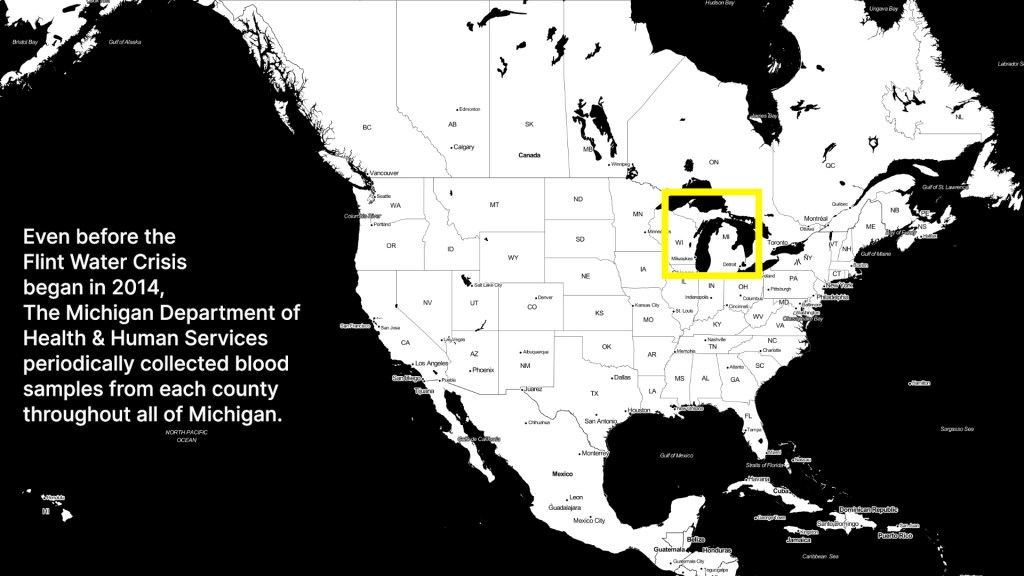
The opening of Datascaping shows the earliest data collection beginning years before the 2015 water switch, when Michigan first starts monitoring blood-lead levels in children and releasing results publicly on the MDHHS website. Data related to the location and type of pipes located in Flint also exists on damaged paper maps dating back decades, however the accessibility of this data or “knowledge” of its existence remains cloudy.
Video Still #1
Post-switch, data collection of lead content in Flint’s water systems skyrockets, as the MDHHS is finally pressured to actively test water samples collected and volunteered by Flint residents. Prompted by the declaration of a state of emergency, the EPA also begin their own collection and testing of water samples from pre-selected sites. The paper maps of Flint’s pipes, which at the time were the only existing data relating to pipe location and material, are finally digitized post-crisis.
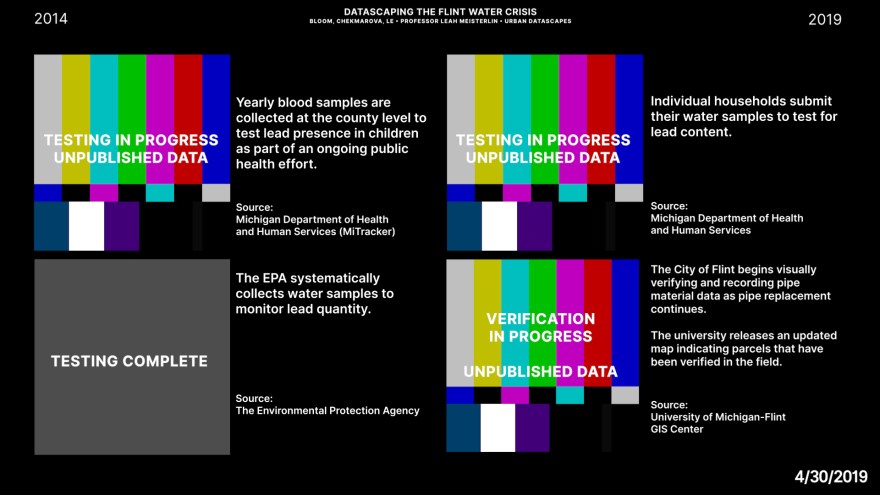
With each screen representing a different data-set, the video shows the creation, growth, and in some cases completion of each data-set over time. Dots on a map represent water samples submitted for testing, with bigger dots indicating a large number of samples from the same location on that day. As time progresses and news of the crisis develops, we see the number of frequency of tests submitted explode in the upper right screen. The image of Flint’s pipe data in the lower right screen appears grainy and distorted as first, but finally becomes clear when the records are digitized for distribution.

Video Still #2
Throughout the video-timeline, all four data-sets appear out of the static at different times, and all last for different durations that reflect the length of data collection. While so-called routine data-sets such as blood samples from the MDHHS (upper left screen) appear before the water source switch in 2015, crisis data-sets collected by the EPA appear late in the video by comparison. All four data-sets appear simultaneously only when all agents involved have monitoring capabilities.
Datascaping uses visual cues like static and test bars to suggest that the viewer is watching the Flint’s water crisis unfold from the perspective of a high-level decision-maker in the same way most of the nation saw it unfold: from a TV set. Arranged in a grid, the four screens together suggest CCTV monitors used for security surveillance, implying a more distant, “birds-eye” view of data collection.
Video Still #3
All content was produced by Julia Bloom, Mariya Chekmarova, and Ri Le for Professor Leah Meisterlin’s Urban Datascapes class
Columbia University GSAPP
