March 2021 – 2022
Listeners are invited to select a location by pushing a button
Ground Truth
Data is an act of imagination. When we see data, we imagine a world. How close is the data to reality? How far?
Each year, the Data Through Design (DxD) exhibition features works that creatively analyze, interpret and interrogate data made available in NYC’s Open Data Portal, a valuable civic resource aimed at increasing information access and transparency. The exhibition opening is a highlight of the New York City Mayor’s Office of Data Analytics and BetaNYC’s Open Data Week. The theme for both the 2021 and 2022 exhibitions was Ground Truth: the insight we receive from being ”on the ground,” collecting or confirming data through direct observation, as opposed to abstract estimates, samples, or reports derived from remote locations. The works shown at both exhibitions investigate datasets’ relationship to a physical place and personal experience.
Compositions: NYC
Originally made for DxD’s 2021 exhibition, Compositions: NYC is a soundboard that allows participants to play and compare field recordings taken at select street corners with soundscapes generated algorithmically using data from NYC Open Data. A collaborative piece created by myself, Michael Hsu, and Sukanya Aneja, Compositions explores the distance between the New York we experience and the New York we imagine through data.
For the 2021 virtual exhibition, Compositions took the form of a website (this version can still be viewed in the virtual gallery). Visitors to the website are invited to select a location by clicking on a location on the map and using the toggle to switch between field recordings and generated soundscapes. Each recording is accompanied by a description to help them understand what they are hearing. Participants can also visit the locations in person to ground truth the fidelity of the generated soundscapes for themselves, and listen to the recordings online at compositions.nyc.

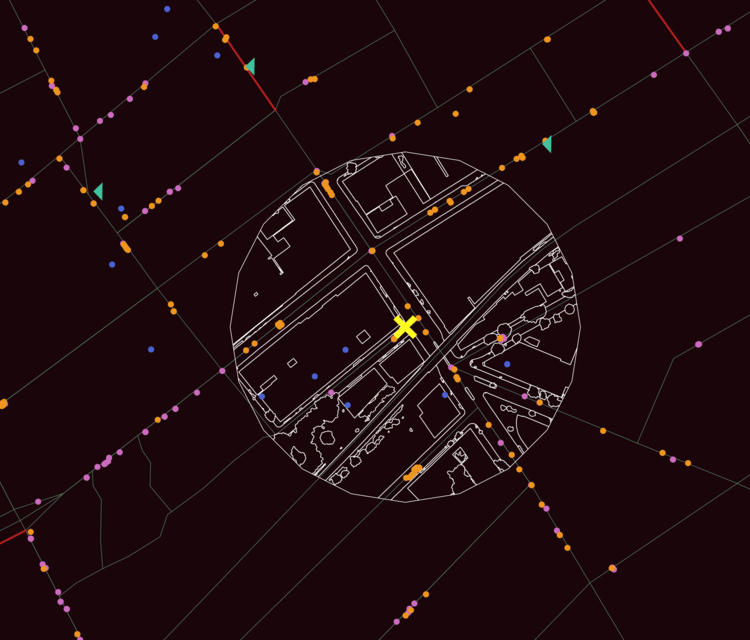
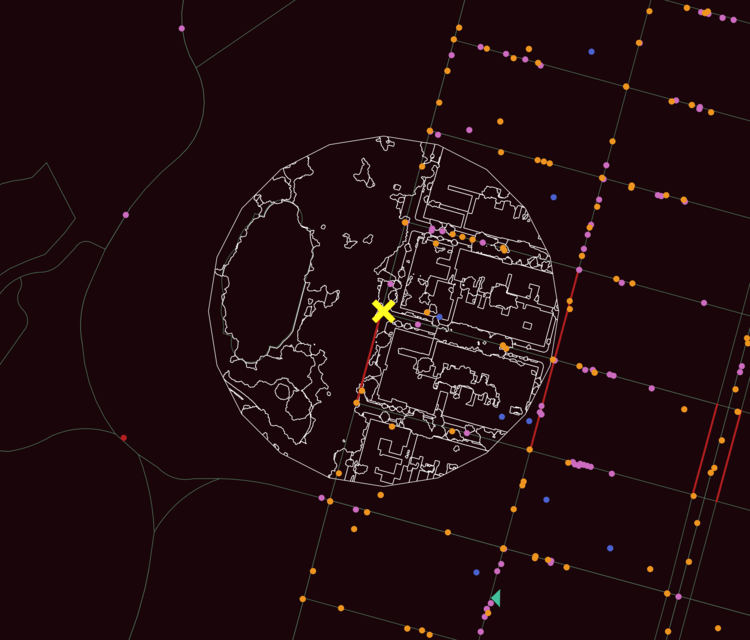


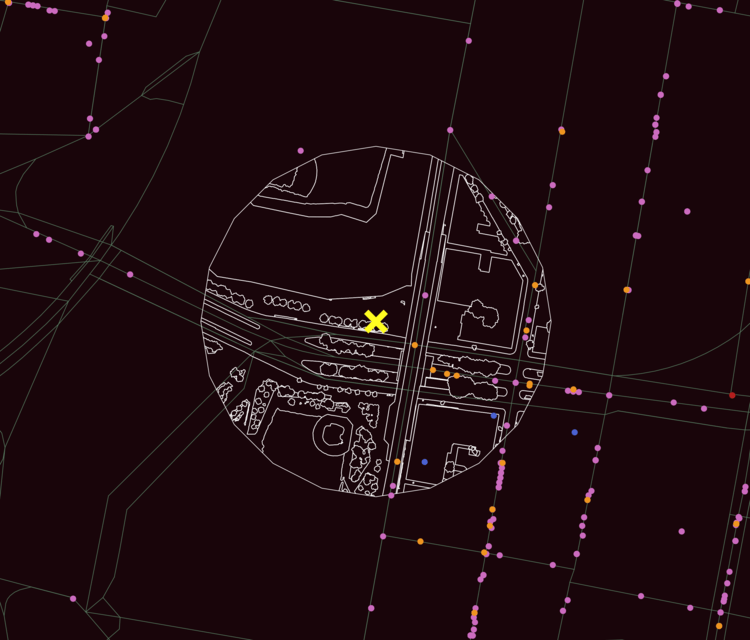
Maps showing data points used to generate the soundscapes and the radius of the selected data used for that location
When generating the soundscapes, we considered a variety of datasets that we felt could represent the ambient noise of the city. Traffic data, pedestrian counts, construction site permits, sidewalk café licenses, and 311 noise complaints all gave us information about the number of cars, the amount of people talking or dining on the street, the likelihood of drilling or sawing noises, and the frequency of loud parties or dogs in a certain area. We also chose not to ignore the possibility of nature sounds throughout the city and used land cover data to estimate where a city-goer might hear birds chirping or the rustling of leaves.
We chose 15 locations spanning all five boroughs which we felt exemplified the diversity of these datasets. A sample of the data from each of the datasets above was then taken within a 150 meter radius of each selected locations. In maps shown above of Times Square, Flushing, the Upper East Side, Bushwick, Williamsburg, and Yankee Stadium, orange points represent construction (both street construction and building construction), blue points represent restaurant terraces (both permits and open street restaurants), pink points represent 311 noise complaints, green arrows represent pedestrian traffic, red lines and points represent vehicle traffic, and white lines outline ground cover including trees.
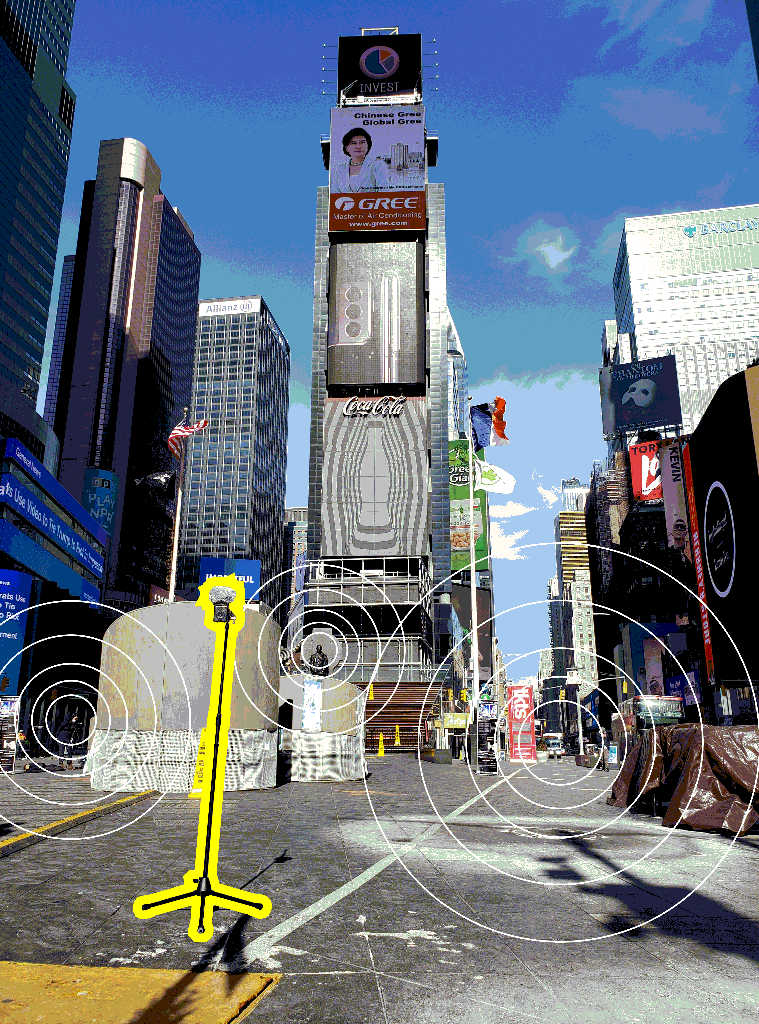

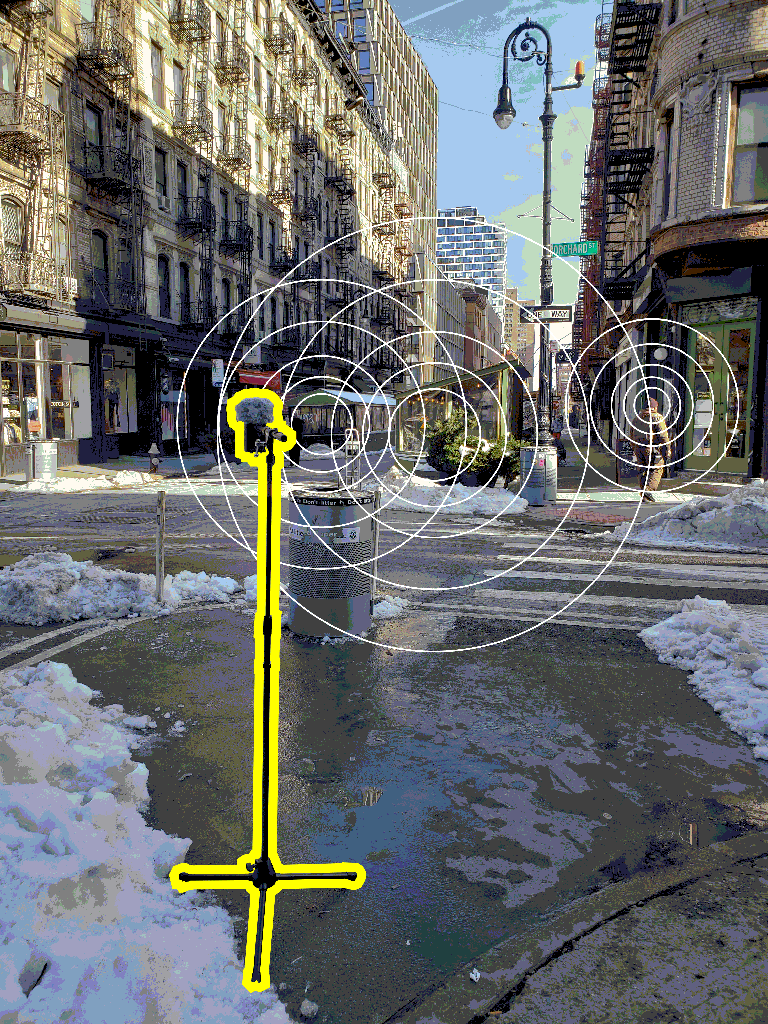

Field recordings taken at Times Square, Flushing, Orchard Street, and the Upper East Side in February 2020
From these data samples, 15 soundscapes were algorithmically generated using a library of stock sounds found online of people’s footsteps, honking vehicles, birds chirping, plates clattering, construction drills whirring, dogs barking, and many other sounds. We then took ambient field recordings at each of these 15 locations using a lone microphone on stand positioned at the height of an average pedestrian. These recordings were taken in mid-February 2020, during what was still the height of the COVID-19 Pandemic and after a significant snowstorm.

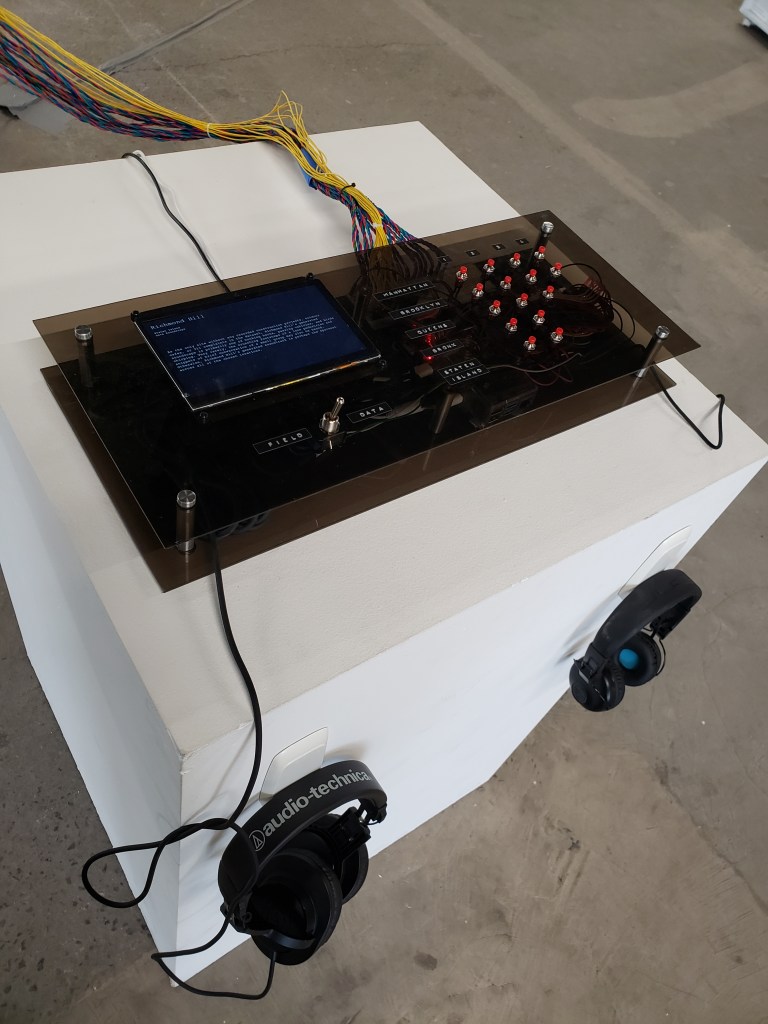
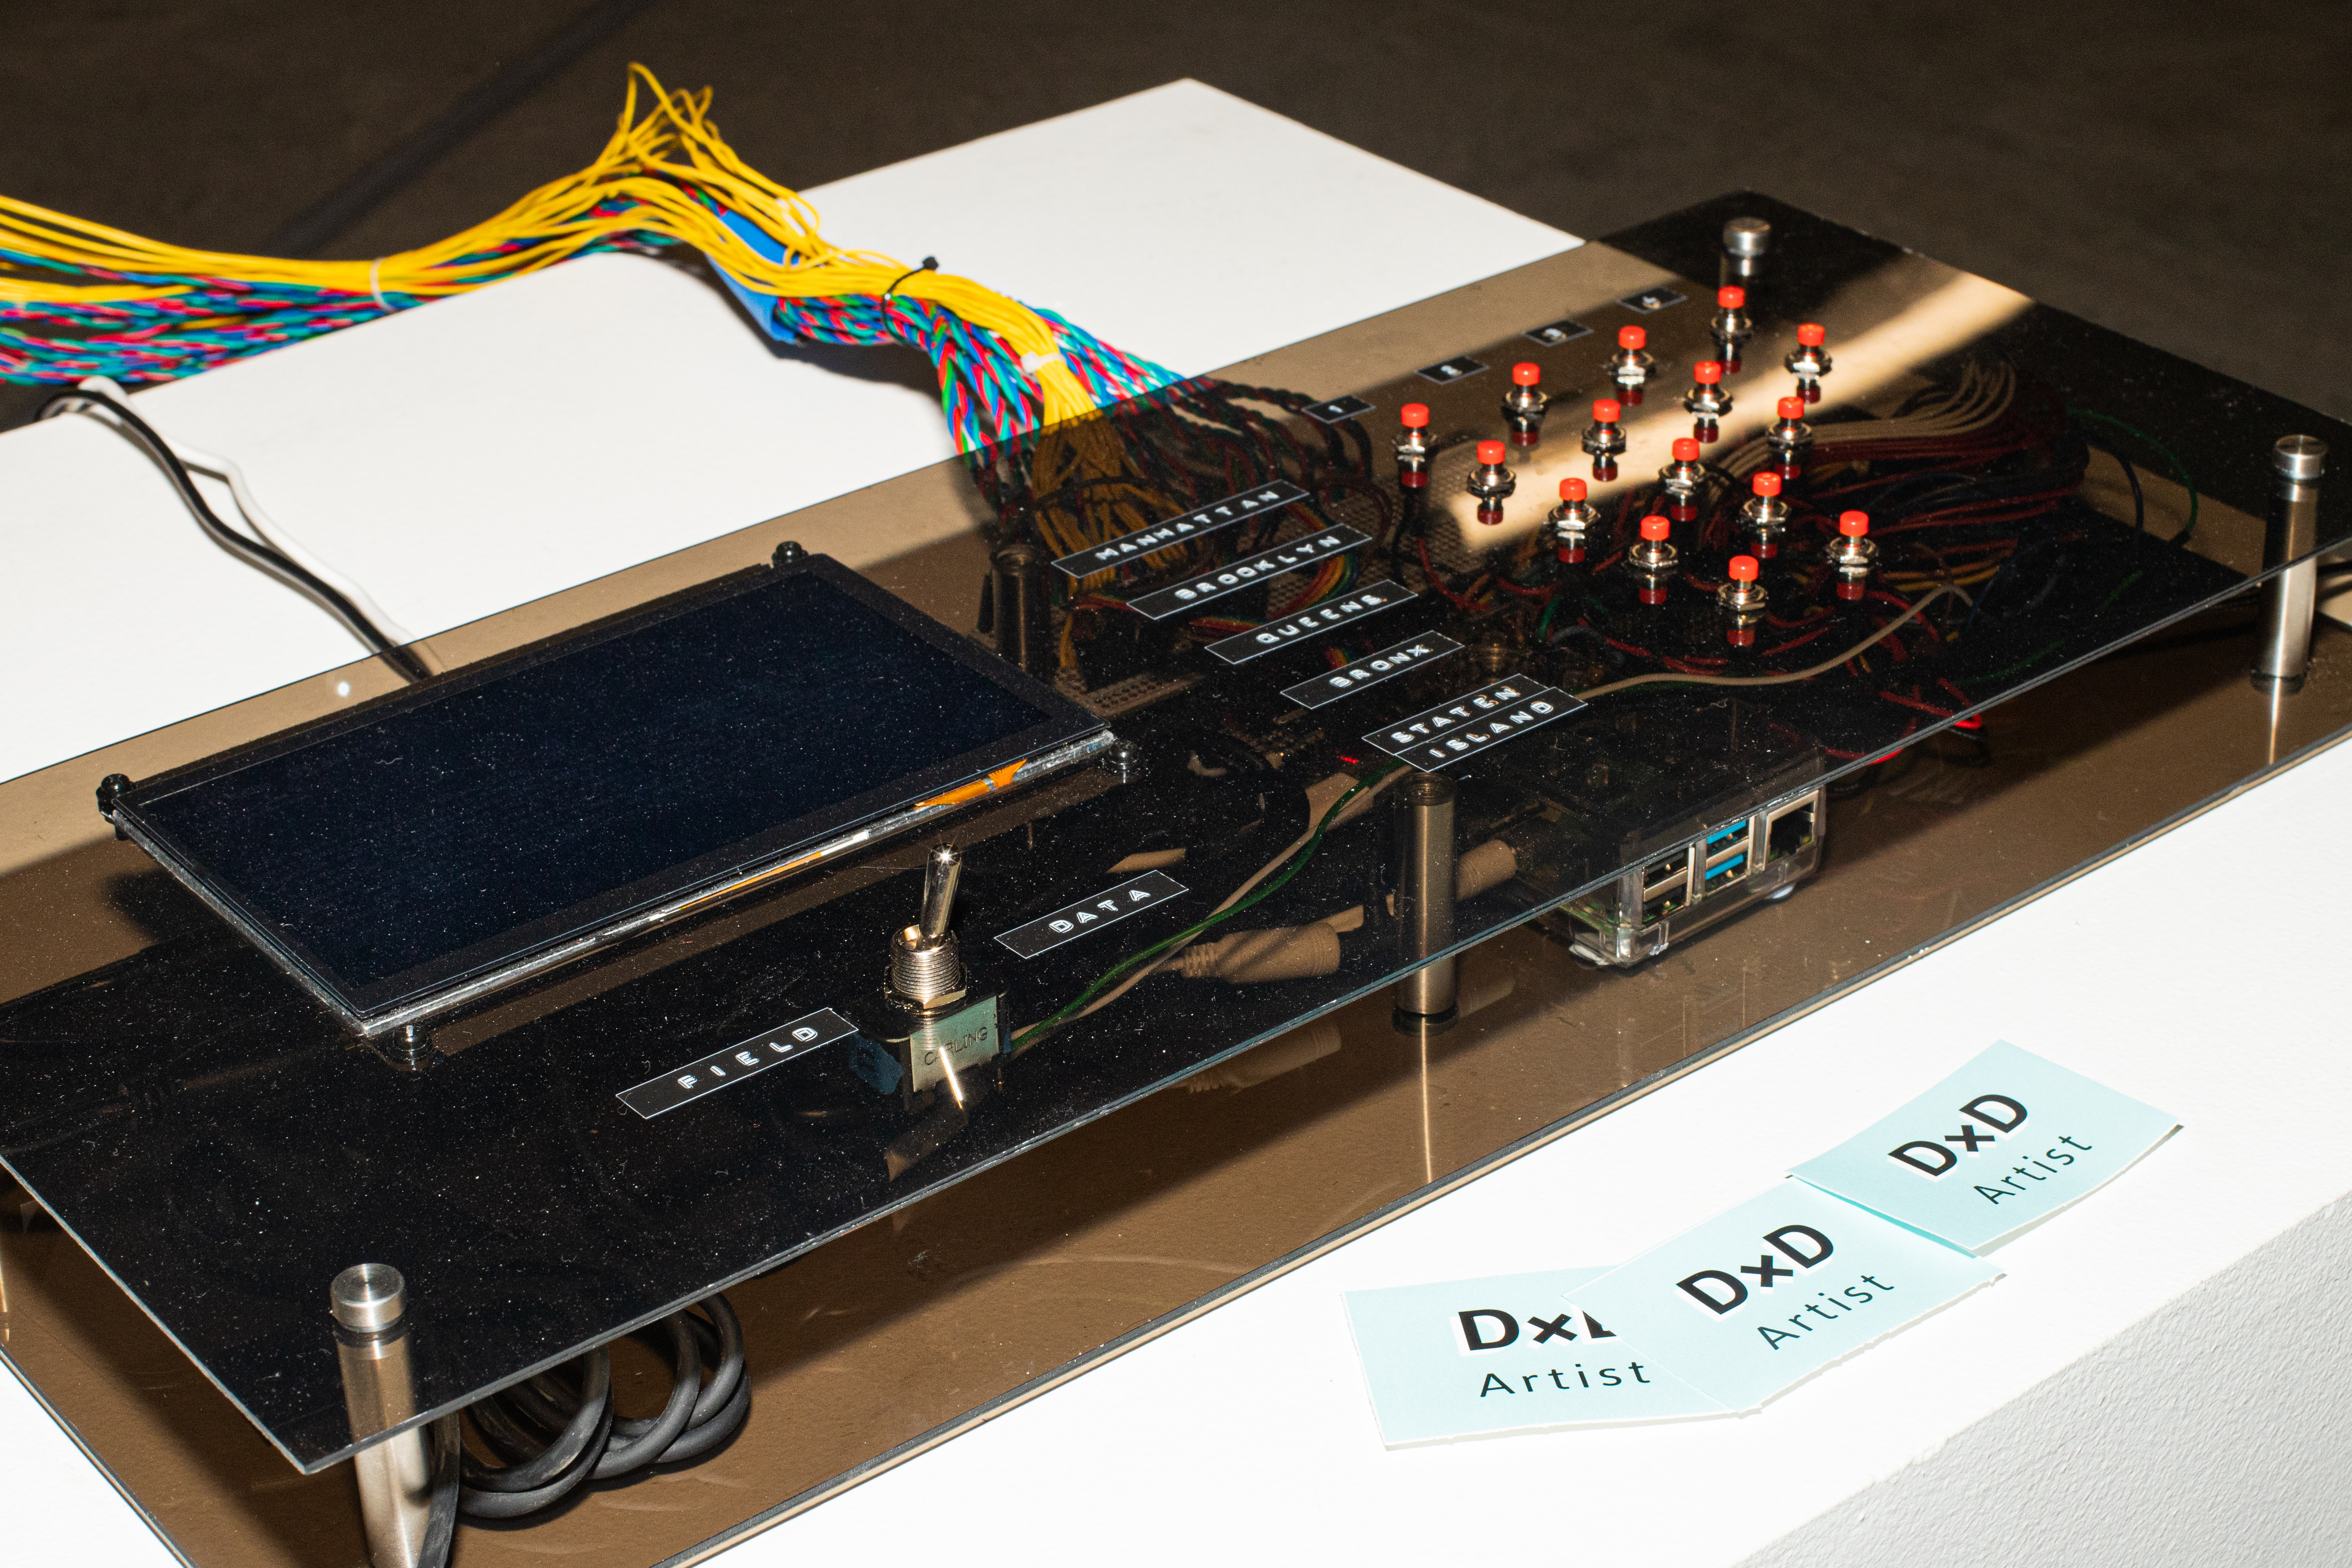
Compositions:NYC in the gallery
For the 2022 exhibition which took place in Brooklyn’s Navy Yard, we were invited to bring Compositions into the gallery as a physical soundboard. This version was fabricated using a few sheets of hand-drilled acrylic, foam board, plastic buttons/toggle, responsive LEDs, many, many yards of wire, and one small screen connected to a Raspberry Pi.
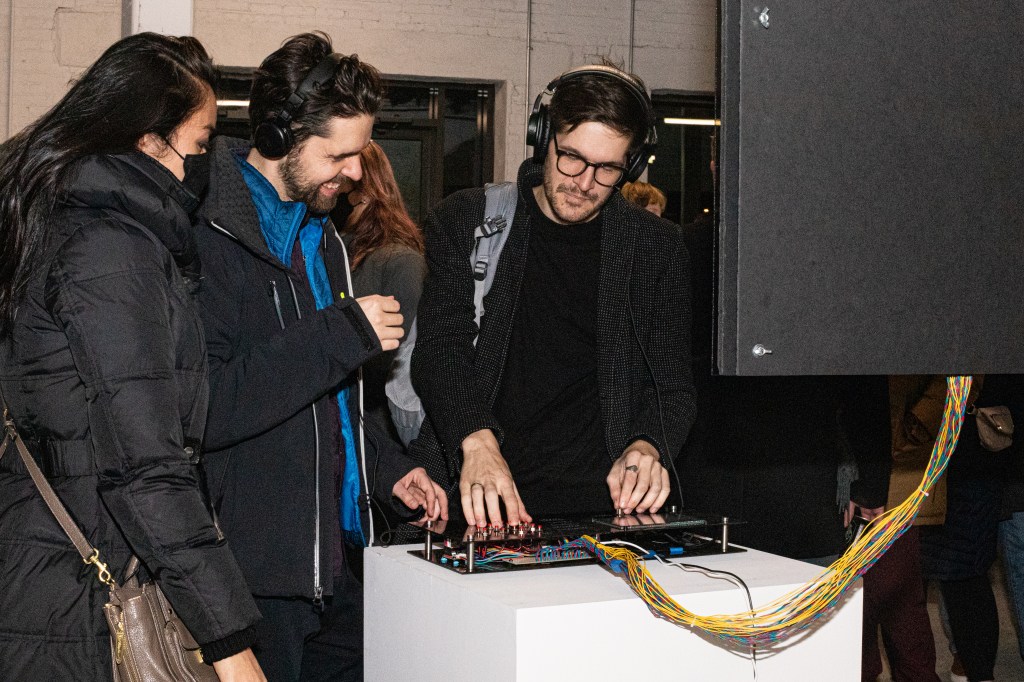
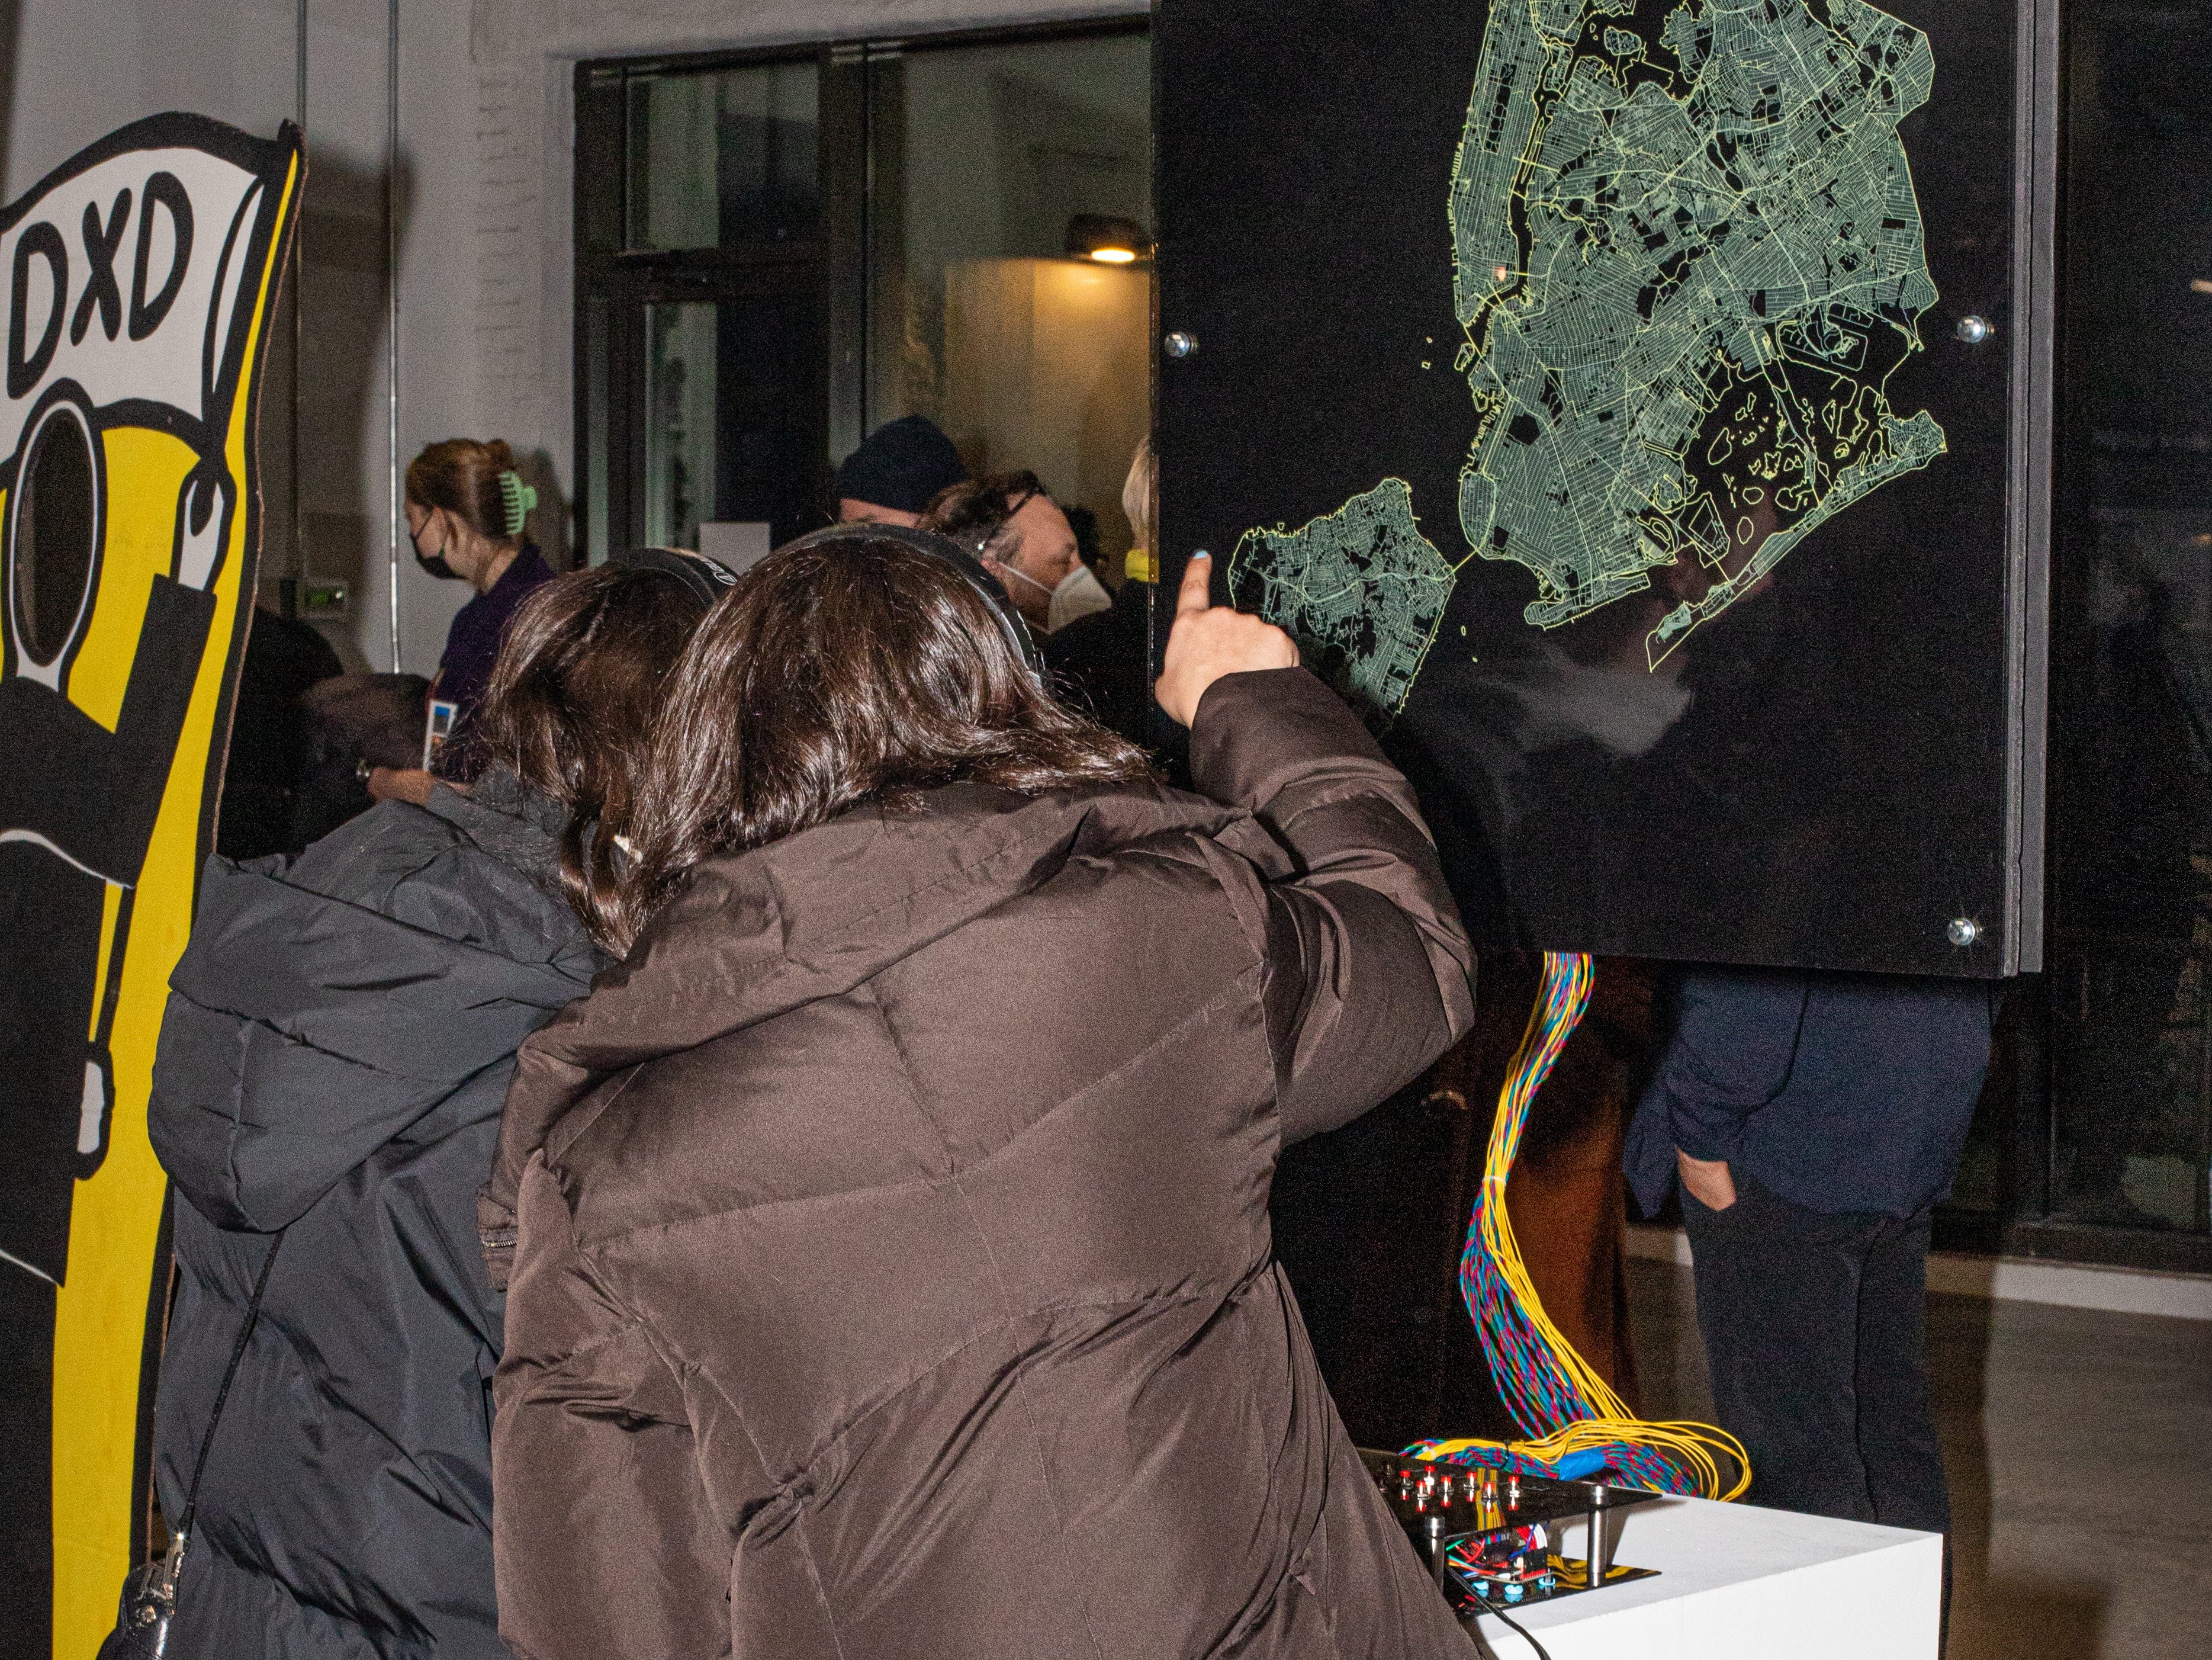
Ground Truth on Opening Night
In comparing the field recording with its algorithmically generated counterpart, listeners may find that the artificial NYC soundscape heightens their awareness of certain noises of the city. They may notice the presence or absence of birds chirping, diners laughing over lunch, the wind, the rain, or the rumbling of a train passing underfoot. The artificial soundscapes may also exaggerate the frequency and intensity of “nuisance” noises like construction, loud pedestrian conversation, street traffic, and so on. They might even find that there is some agreement between the computer-generated soundscapes and the field recordings. Perhaps they will find, as we did, that so much of the character of a city depends, on the time of day, the weather, or the moods of passersby—the countless coincidences from which emerges the sounds of life.
DxD’s 2021 virtual exhibition “Ground Truth” can still be viewed in its entirety here, and an archive of the 2022 “Ground Truth IRL” exhibition is also available here.
Datasets Used:
311 Service Requests from 2010 to Present
Street Construction Permits
DOB Permit Issuance
Sidewalk Café Licenses and Applications
Open Restaurant Applications
Bi-annual Pedestrian CountsTraffic Volume Counts (2014-2019)
Land Cover Raster Data (2017) – 6in Resolution
